New Mass Times
I have posted the new Mass times, following all of our Town Halls. You can find the full post, with priest rotation, here.
Bellingham
- [Sat.] 5:00 pm – Assumption
- 8:00 am – Assumption
- 9:00 am – Sacred Heart
- 10:00 am – Assumption
- 11:00 am – Sacred Heart
- 1:00 pm – Assumption (Spanish)
- 5:00 pm – Sacred Heart (w/ WWU)
Northwest County
- [Sat.] 5:00 pm – Blaine
- 8:30 am – Lummi
- 10:30 am – Ferndale
Sunday – North / East County
- [Sat.] 5:00 pm – Lynden
- [Sat.] 7:00 pm – Lynden (Spanish)
- 8:30 am – Deming
- 11:00 am – Lynden
Staff Salaries
In conjunction with the staffing changes I wrote about last month, I have also been doing a deeper analysis of staff pay in order to provide our annual cost-of-living increases. It is a little bit complicated, but I also think you should know the realities that we face as a church.
Total Money Available
County-wide, our year-over-year (July ’23 – June ’24 vs. July ’24 – June ’25) collections increased by 3.13%. This is actually healthy, and (I suspect) the first time in a long time that our parishes have collectively stayed even with inflation.
Sound budgeting practices suggest that we should only increase spending at the same rate that donations have increased. I did not respect that practice last year (because I was so desperate to hire certain staff and to equalize some pay), which pushed us into a deficit. As such, it is especially important that I respect that principle this year.
Last year’s total salary expense across the county was $1,126,168.
Multiply by 3.13%, and I have $35,249 to work with this year.
I used a sizable chunk of this to hire a Regional Marriage Coordinator, which our faith formation staff was desperately asking for. Unfortunately, using increased giving to add hours decreases the amount of money I can use for staff raises, but this was such a desperate need that it felt necessary.
I also used a sizable chunk of this to catch certain staff members up on the pay scale, especially those who were below the Archdiocesan minimum recommendation for their job classifications.
What remained I distributed equally amongst the staff, proportional to their FTEs.
The end result was an average 1.67% (median 1.10%) raise for our staff this year, which is only about half of the Archdiocesan recommended cost-of-living increase.
The only way to do better for our staff in future years is (1) for donations to increase significantly more than inflation (a la 5%+) or (2) to find a way to reduce expenses significantly enough that salaries can increase more than giving, mostly by either reducing staff hours or reducing professional services / contractors.
Pay Scale Disparities
Every year, the Archdiocese publishes a budgeting memo that includes a lay staff pay scale based on a comparative analysis of other non-profits. It also includes a cost-of-living increase based on the previous year’s economic factors.
This year, after an extensive market analysis, the Archdiocese changed where many staff positions fell on the pay scale. In response, I spent some significant time making sure our staff positions were appropriately classified, and now I am very confident that Whatcom Catholic is appropriately aligned with the Archdiocesan pay scale.
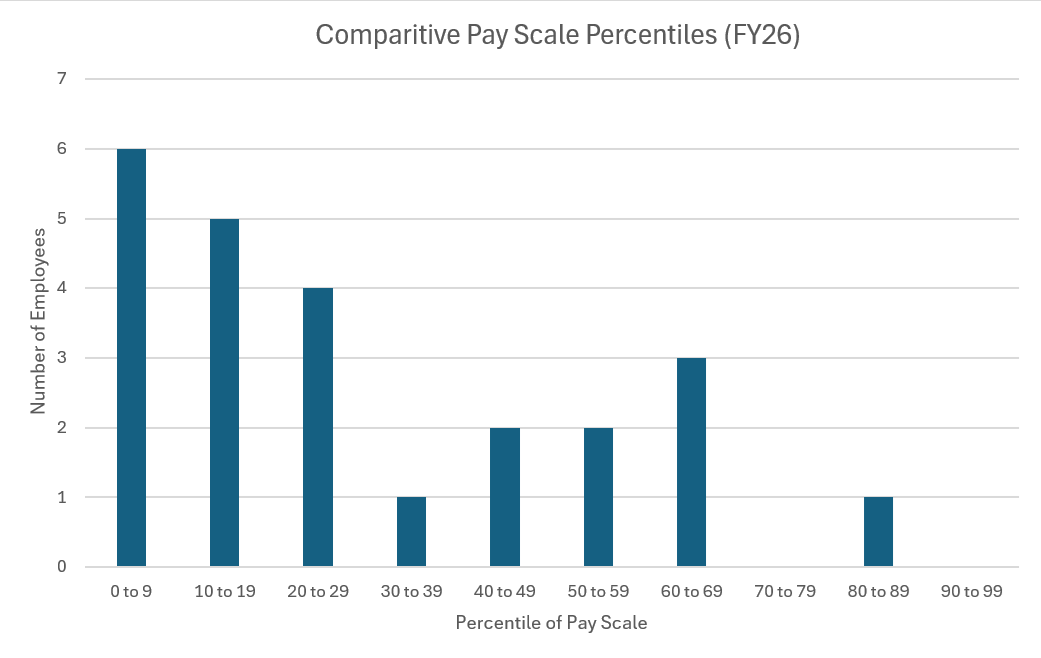
Unfortunately, before Partners in the Gospel began, our churches had comparable staff at very different pay levels relative to the Archdiocesan pay scale. Following the drastic changes this year, those disparities have not improved. It is still my goal to make sure everyone makes the same percentile of their pay scale [i.e., someone at level “4” and someone at level “8” will not make the same amount, but they should make the same amount (e.g. 50th percentile) of their relative pay scales]. Unfortunately, the only way to catch people up who are on the low end of their pay scales is to give them raises greater than cost-of-living, which again requires either higher rates of giving or lower expenses.
Two helpful charts:
| FY25 – Old Pay Scales | FY26 – New Pay Scales, Before Cost-of-Living Adjustments | FY26 – New Pay Scales, After Cost-of-Living-Adjustments | |
| Average Percentile | 47.6% | 27.8% | 29.6% |
| Median Percentile | 50.0% | 22.0% | 22.9% |
| Standard Deviation | 19.8% | 23.9% | 23.5% |
This is the amount of additional annual giving county-wide it would require to get our employees to different minimum pay scale levels:
- 10th percentile – $8,157
- 25th percentile – $46,504
- 50th percentile – $140,825
